How? How?

Our project enables Manivahn to grow her business.

How?

LEARN MORE
How? How?

Our client's project provides energy and employment.

How?

LEARN MORE
Where? Where?

Antora and her friends will soon walk a safer path to school.

Where?

LEARN MORE
How? How?

A new road enables Ataur to access markets.

How?

LEARN MORE
Why? Why?

Sahena is able to buy goods safely from the market.

Why?

LEARN MORE
How? How?

Our client's energy project helps improve schools.

How?

LEARN MORE
2019 AIIB ANNUAL REPORT AND FINANCIALS
DOWNLOAD REPORT
DOWNLOAD FINANCIALS

2019 at a Glance (As of end-2019)

OUR MEMBERS

102
76 MEMBERS,
26 PROSPECTIVE MEMBERS

OUR PROJECTS

63

OUR INVESTMENTS

12.04
BILLION USD

PRIVATE CAPITAL WE'VE MOBILIZED

1.89
BILLION USD

OUR PROFESSIONAL STAFF

279

OUR FEMALE PROFESSIONAL STAFF

108
(39% OF TOTAL)

OUR STAFF’S NATIONALITIES

50

Who We Are and What We Do

In 2016, the Asian Infrastructure Investment Bank (AIIB) began operations to help foster social and economic development, create wealth and improve infrastructure connectivity in Asia by investing in sustainable infrastructure and other productive sectors. We help our members meet their Sustainable Development Goals and their Nationally Determined Contributions according to the Paris Agreement. We believe Asia’s future prosperity will be driven by inclusive and sustainable development. Building on our core values of Lean, Clean and Green, we contribute to broad economic and social development in Asia and beyond by helping finance vital infrastructure—infrastructure that is financially, economically, socially and environmentally sustainable and supports one or more of our thematic priorities. We believe tomorrow’s infrastructure will look very different. It will be shaped by rapid changes in the way markets function and how people live, move and work. What is built, how it is built and where it is built will evolve as the needs of people, the economy and the world change.

From Our Board of Directors
ENLARGE

Historical Data *

  • YEAR
  • TOTAL
  • STAND-ALONE**
  • End-2019
  • 63 Projects (Total)

    % Change

    2018 80%
    2017 174%
    2016 668%
  • 33 Projects (Stand-alone
    (out of total for the indicated year))


    % Change

    2018 136%
    2017 371%
    2016 1550%
  • End-2018
  • 35 Projects (Total)

    % Change

    2017 52%
    2016 338%
  • 14 Projects (Stand-alone
    (out of total for the indicated year))


    % Change

    2017 100%
    2016 600%
  • End-2017
  • 23 Projects (Total)

    % Change

    2016 188%
  • 7 Projects (Stand-Alone
    (out of total for the indicated year))


    % Change

    2016 250%
  • End-2016
  • 8
  • 2
  • COFINANCED**
  • SOVEREIGN**
  • NONSOVEREIGN**
  • 30 Projects (Cofinanced
    (out of total for the indicated year))


    % Change

    2018 43%
    2017 88%
    2016 400%
  • 40 Projects (Sovereign
    (out of total for the indicated year))


    % Change

    2018 60%
    2017 135%
    2016 471%
  • 23 Projects (Nonsovereign
    (out of total for the indicated year))


    % Change

    2018 130%
    2017 283%
    2016 2200%
  • 21 Projects (Cofinanced)

    % Change

    2017 31%
    2016 250%
  • 25 Projects (Sovereign)

    % Change

    2017 47%
    2016 257%
  • 10 Projects (Nonsovereign)

    % Change

    2017 67%
    2016 900%
  • 16 Projects (Cofinanced)

    % Change

    2016 167%
  • 17 Projects (Sovereign)

    % Change

    2016 143%
  • 6 Projects (Nonsovereign)

    % Change

    2016 500%
  • 6
  • 7
  • 1
Click to generate chart
  • YEAR
  • SUSTAINABLE INFRASTRUCTURE
  • End-2019
  • 40 Sustainable Infrastructure

    % Change

    2018 135%
    2017 135%
    2016 1900%
  • End-2018
  • 17 Sustainable Infrastructure

    % Change

    2017 55%
    2016 750%
  • End-2017
  • 11 Sustainable Infrastructure

    % Change

    2016 450%
  • End-2016
  • 2
  • CROSS-BORDER CONNECTIVITY
  • PRIVATE CAPITAL MOBILIZATION
  • OTHERS
  • 6 Cross-Border Connectivity

    % Change

    2018 110%
    2017 110%
    2016 140%
  • 26 Private Capital Mobilization

    % Change

    2018 100%
    2017 100%
    2016 1200%
  • 8 Others

    % Change

    2018 33%
    2017 33%
    2016 700%
  • 5 Cross-Border Connectivity

    % Change

    2017 -
    2016 25%
  • 13 Private Capital Mobilization

    % Change

    2017 86%
    2016 550%
  • 6 Others

    % Change

    2017 100%
    2016 500%
  • 5 Cross-Border Connectivity

    % Change

    2016 25%
  • 7 Private Capital Mobilization

    % Change

    2016 250%
  • 3 Others

    % Change

    2016 200%
  • 4
  • 2
  • 1
Click to generate chart
  • YEAR
  • ENERGY
  • FINANCE
  • TRANSPORT
  • End-2019
  • 19 Energy

    % Change

    2018 58%
    2017 58%
    2016 375%
  • 15 Finance

    % Change

    2018 25%
    2017 25%
    2016 275%
  • 13 Transport

    % Change

    2018 44%
    2017 44%
    2016 333%
  • End-2018
  • 12 Energy

    % Change

    2017 110%
    2016 200%
  • 12 Finance

    % Change

    2017 20%
    2016 200%
  • 9 Transport

    % Change

    2017 50%
    2016 200%
  • End-2017
  • 10 Energy

    % Change

    2016 150%
  • 10 Finance

    % Change

    2016 150%
  • 6 Transport

    % Change

    2016 100%
  • End-2016
  • 4
  • 4
  • 3
  • WATER
  • URBAN
  • ICT
  • OTHERS
  • 8 Water

    % Change

    2018 60%
    2017 60%
    2016 -
  • 4 Urban

    % Change

    2018 100%
    2017 100%
    2016 300%
  • 2 ICT

    % Change

    2018 100%
    2017 100%
    2016 -
  • 2 Others

    % Change

    2018 -
    2017 -
    2016 -
  • 5 Water

    % Change

    2017 150%
    2016 -
  • 2 Urban

    % Change

    2017 100%
    2016 100%
  • 1 ICT

    % Change

    2017 0%
    2016 -
  • 0 Others

    % Change

    2017 -
    2016 -
  • 2 Water

    % Change

    2016 -
  • 1 Urban

    % Change

    2016 -
  • 1 ICT

    % Change

    2016 -
  • 0 Others

    % Change

    2016 -
  • 0
  • 1
  • 0
  • 0
Click to generate chart
  • YEAR
  • APPROVED
  • End-2019
  • USD12.04 billion Approved

    % Change

    2018 61%
    2017 187%
    2016 612%
  • End-2018
  • USD7.50 billion Approved

    % Change

    2017 79%
    2016 344%
  • End-2017
  • USD4.19 billion Approved

    % Change

    2016 148%
  • End-2016
  • USD1.69 billion
  • NET COMMITTED
  • DISBURSED
  • USD8.37 billion Net Committed

    % Change

    2018 13%
    2017 105%
    2016 401%
  • USD2.90 billion Disbursed

    % Change

    2018 104%
    2017 263%
    2016 28900%
  • USD7.38 billion Net Committed

    % Change

    2017 80%
    2016 342%
  • USD1.42 billion Disbursed

    % Change

    2017 78%
    2016 14100%
  • USD4.09 billion Net Committed

    % Change

    2016 145%
  • USD0.80 billion Disbursed

    % Change

    2016 7900%
  • USD1.67 billion
  • USD0.01 billion
Click to generate chart
  • YEAR
  • TOTAL***
  • End-2019
  • 102 Total
    (aggregated, members and prospective members)
    % Change

    2017 10%
    2017 21%
    2016 79%
  • End-2018
  • 93 Total
    (aggregated, members and prospective members)
    % Change

    2017 11%
    2016 63%
  • End-2017
  • 84 Total
    (aggregated, members and prospective members)
    % Change

    2016 47%
  • End-2016
  • 57
  • REGIONAL**
  • NONREGIONAL**
  • BORROWING MEMBERS**
  • 50 Regional

    (out of total for the indicated year)
    % Change


    2018 -
    2017 4%
    2016 35%
  • 52 Nonregional

    (out of total for the indicated year)
    % Change

    2018 21%
    2017 44%
    2016 160%
  • 21 Borrowing Members

    (out of total for the indicated year)
    % Change

    2018 62%
    2017 75%
    2016 200%
  • 50 Regional

    (out of total for the indicated year)
    % Change

    2017 4%
    2016 35%
  • 43 Nonregional

    (out of total for the indicated year)
    % Change

    2017 19%
    2016 115%
  • 13 Borrowing Members

    (out of total for the indicated year)
    % Change

    2017 8%
    2016 86%
  • 48 Regional

    (out of total for the indicated year)
    % Change

    2016 30%
  • 36 Nonregional

    (out of total for the indicated year)
    % Change

    2016 80%
  • 12 Borrowing Members

    (out of total for the indicated year)
    % Change

    2016 71%
  • 37
  • 20
  • 7
Click to generate chart
  • YEAR
  • TOTAL PROFESSIONAL STAFF COUNT
  • End-2019
  • 279 Total Professional Staff Count

    % Change

    2018 50%
    2017 113%
    2016 253%
  • End-2018
  • 186 Total Professional Staff Count

    % Change

    2017 42%
    2016 135%
  • End-2017
  • 131 Total Professional Staff Count

    % Change

    2016 66%
  • End-2016
  • 79
  • FEMALE PROFESSIONAL STAFF
  • NATIONALITIES REPRESENTED
  • 108 (39% of total) Female Professional Staff

    % Change

    2018 83%
    2017 157%
    2016 500%
  • 50 Nationalities Represented

    % Change

    2018 14%
    2017 39%
    2016 117%
  • 59 (32% of total) Female Professional Staff

    % Change

    2017 40%
    2016 228%
  • 44 Nationalities Represented

    % Change

    2017 22%
    2016 91%
  • 42 (32% of total) Female Professional Staff

    % Change

    2016 133%
  • 36 Nationalities Represented

    % Change

    2016 57%
  • 18 (23% of total)
  • 23
Click to generate chart
  • YEAR
  • COMMITMENT CONTRIBUTIONS
  • PREPARATION GRANTS APPROVED
  • End-2019
  • USD128 million Commitment Contributions

    % Change

    2018 -
    2017 19%
    2016 121%
  • USD11.31 million Preparation Grants Approved

    % Change

    2018 58%
    2017 565%
    2016 -
  • End-2018
  • USD128 million Commitment Contributions

    % Change

    2017 19%
    2016 121%
  • USD7.18 million Preparation Grants Approved

    % Change

    2017 322%
    2016 -
  • End-2017
  • USD108 million Commitment Contributions

    % Change

    2016 86%
  • USD1.70 million Preparation Grants Approved

    % Change

    2016 -
  • End-2016
  • USD58 million
Click to generate chart
  • YEAR
  • PRIVATE CAPITAL MOBILIZED
  • End-2019
  • USD1,894.36 million Private Capital Mobilized

    % Change

    2018 165%
    2017 235%
    2016 38093%
  • End-2018
  • USD715.96 million Private Capital Mobilized

    % Change

    2017 27%
    2016 14335%
  • End-2017
  • USD565.96 million Private Capital Mobilized

    % Change

    2016 11310%
  • End-2016
  • USD4.96 million
Click to generate chart
  • YEAR
  • IOCT PROCUREMENT
  • End-2019
  • USD2374.7 million IOCT Procurement

    % Change

    2018 126%
    2017 168%
    2016 386%
  • End-2018
  • USD1050.5 million IOCT Procurement

    % Change

    2017 19%
    2016 115%
  • End-2017
  • USD885 million IOCT Procurement

    % Change

    2016 81%
  • End-2016
  • USD489 million
Click to generate chart
* Cumulative year-end figures. “Approved” investment figures reflect maximum amount approved. “Net Committed” equals committed amount less canceled amount. “Disbursed” refers to the amount of cash disbursement and capitalized charges. Approved membership numbers are aggregated (members plus prospective members) as of indicated year-end. “Borrowing Members” are Members with approved loans from AIIB. “Private Capital Mobilized” includes both direct and indirect involvement of AIIB that led to the commitment of private entities’ financing. “Special Fund” refers to grants that support the preparation of projects to be financed by AIIB. Some projects are classified under more than one thematic priority; total may exceed actual number of approved projects. “IOCT” refers to International Open Competitive Tendering Procurement for sovereign-backed stand-alone and cofinanced investments.

** Out of total for the indicated year

*** Aggregated, members and prospective members

From Our President

The end of 2019 marked AIIB’s entry into its fifth year of operations, the last of our start-up phase. It was a year of growth, development and learning for the institution as we expanded our capacity to serve our clients.

From Our Board of Directors
ENLARGE
In 2019 alone we welcomed nine new proposed members to our Bank, meaning our 102 shareholders across the world now represent 79 percent of the global population. Our staff numbers grew by 50 percent over the year, reaching 279 by the end of 2019. We increased the range of financial products we can offer, including local currency financing, partial credit guarantees, variable-spread loans and non-USD hard currency loans. We expanded our operations to include seven additional AIIB members. And of course, the volume of our investment also continued to grow, amounting to more than USD12 billion in approved financing by the end of the year.

2019 was also a year of firsts for AIIB, including the achievement of AIIB’s first external attestation of its effective internal controls over financial reporting, which is a keystone of investor confidence and the result of enhanced governance and high-quality controls.

2019 also saw the inclusion of a first-of-its-kind Climate Change Investment framework as part of our AIIB Climate Bond Portfolio. We also announced our subscription for preference shares in Bayfront Infrastructure Management Pte. Ltd., a first-of-its-kind platform designed to mobilize a new pool of institutional capital for infrastructure debt in Asia.

Another first for AIIB in 2019 was the issuance of its USD2.5-billion five-year bond. This much-anticipated inaugural transaction in the debt capital markets attracted over 4.4 billion orders from more than 90 investors across the globe, representing 27 countries. We feel this demonstrates investor commitment to driving socioeconomic development in Asia. These examples of innovation and partnership between an MDB and the private sector speak to our ambitions as a bank and a member of the international development community.

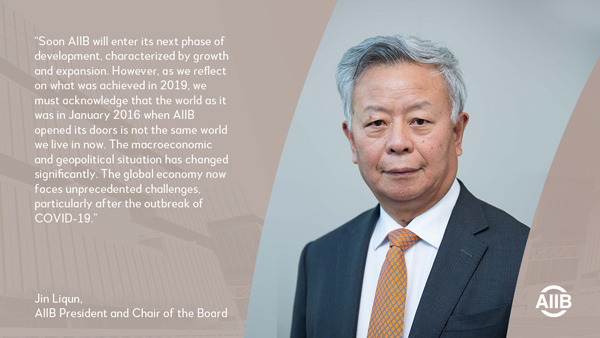
Soon AIIB will be entering its next phase of development, which will be characterized by growth and expansion. However, as we reflect on what was achieved over the past year, we must acknowledge that the world as it was in January 2016 when AIIB opened its doors is not the same world we live in now. The macroeconomic and geopolitical situation has changed significantly. The global economy now faces unprecedented challenges, particularly after the outbreak of the COVID-19 pandemic.

The COVID-19 crisis will be a litmus test of our ability to address formidable unprecedented challenges. Will AIIB prove to be agile and flexible enough to assist our members when unexpected circumstances arise? Now is the time for AIIB to demonstrate its adaptability, resilience, responsiveness and readiness by stepping in to provide our public and private sector clients with urgent financial support. AIIB’s COVID-19 Crisis Recovery Facility allows us to support our members and clients in alleviating and mitigating economic, financial, social and public health pressures arising from COVID-19.

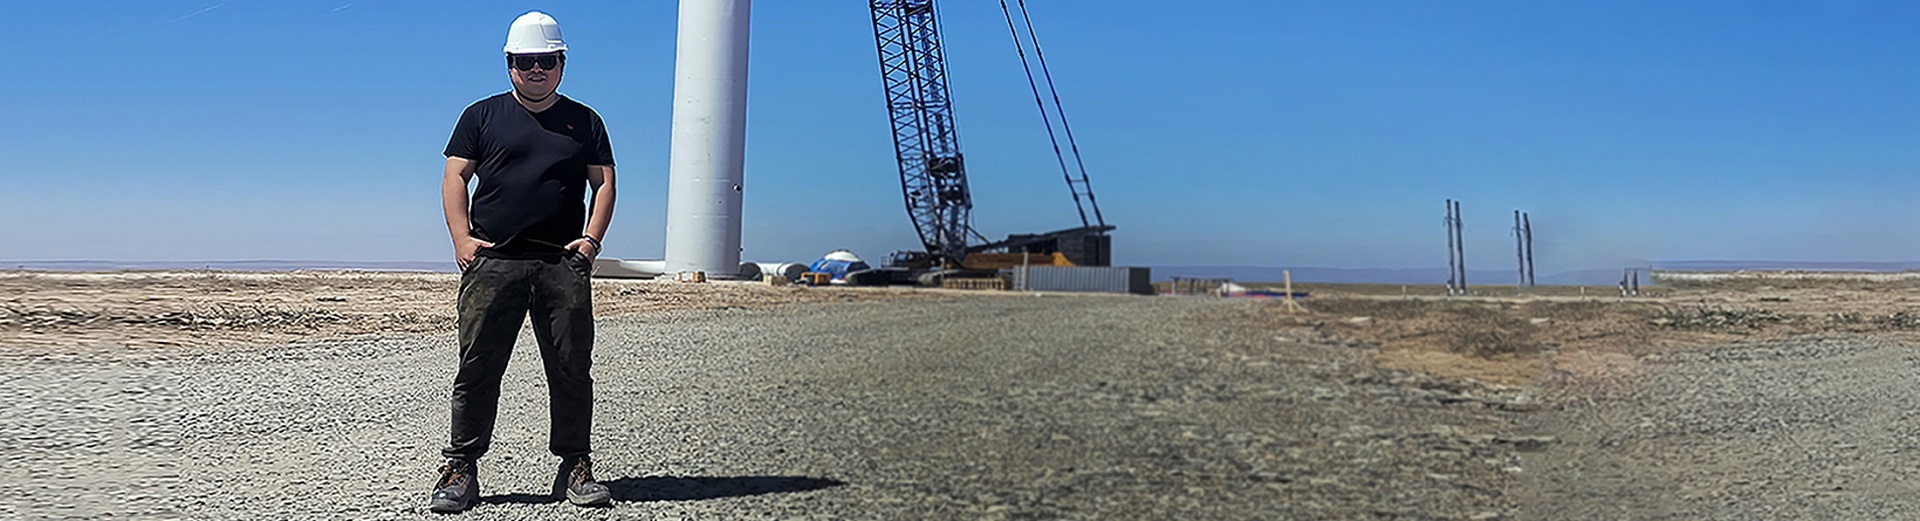
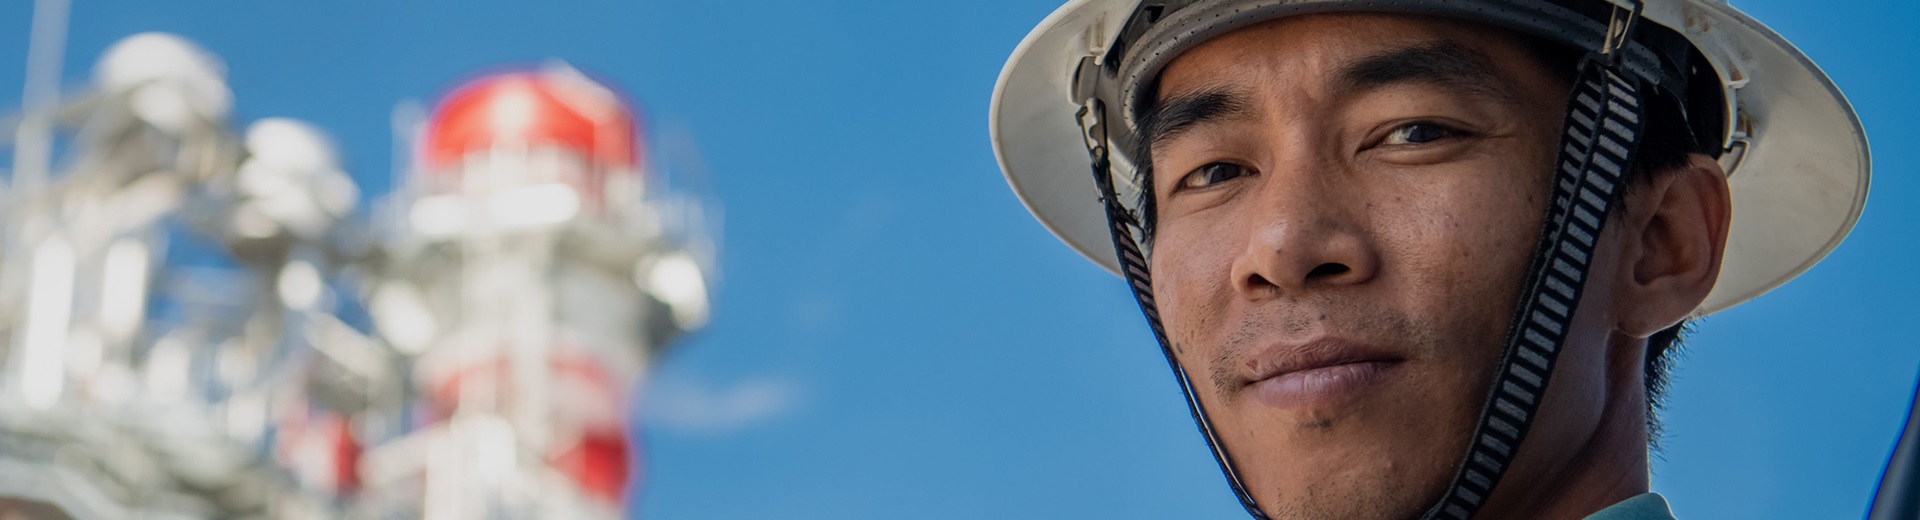
While the long-term consequences of the current crisis are yet to play out, it is likely that increasing fiscal pressures and economic slowdown will lead to a sharp drop in infrastructure investment, further widening what was already a very large gap. It is therefore critical that key infrastructure investments, particularly those mitigating climate change, continue to receive financing.

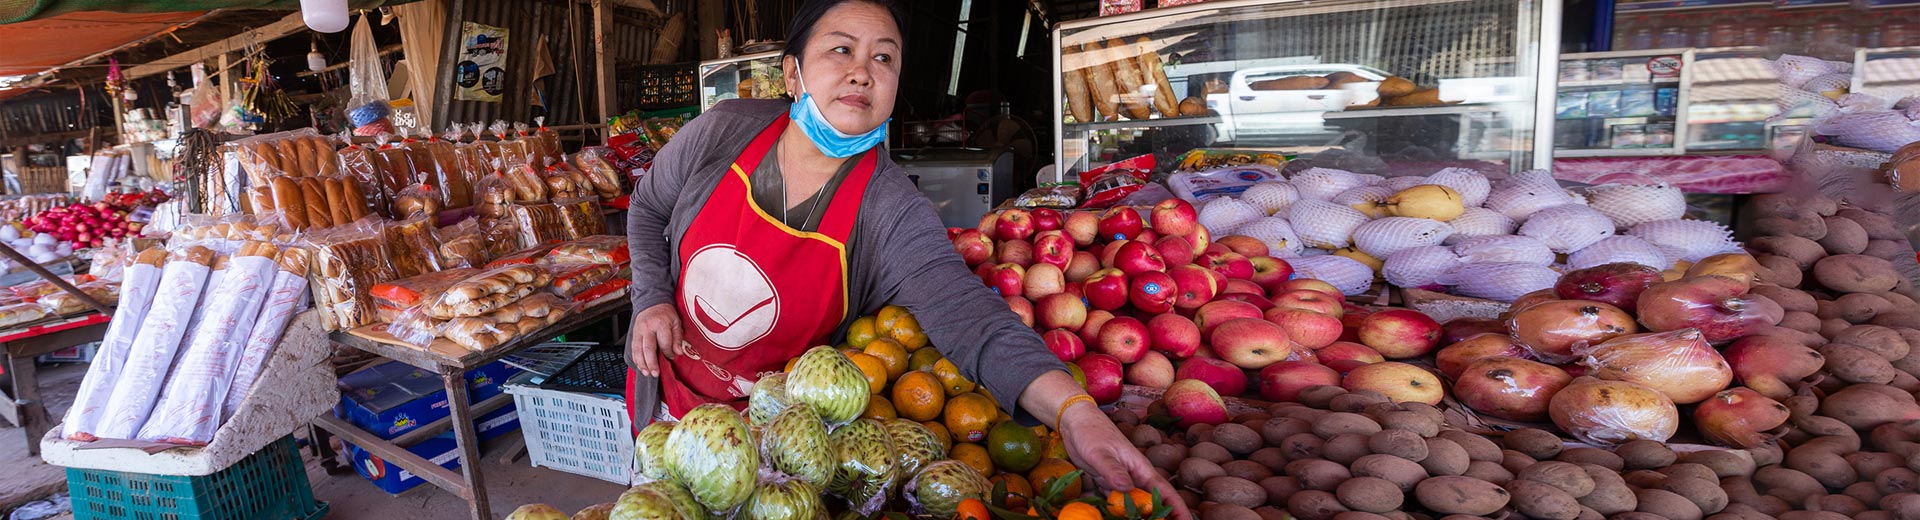
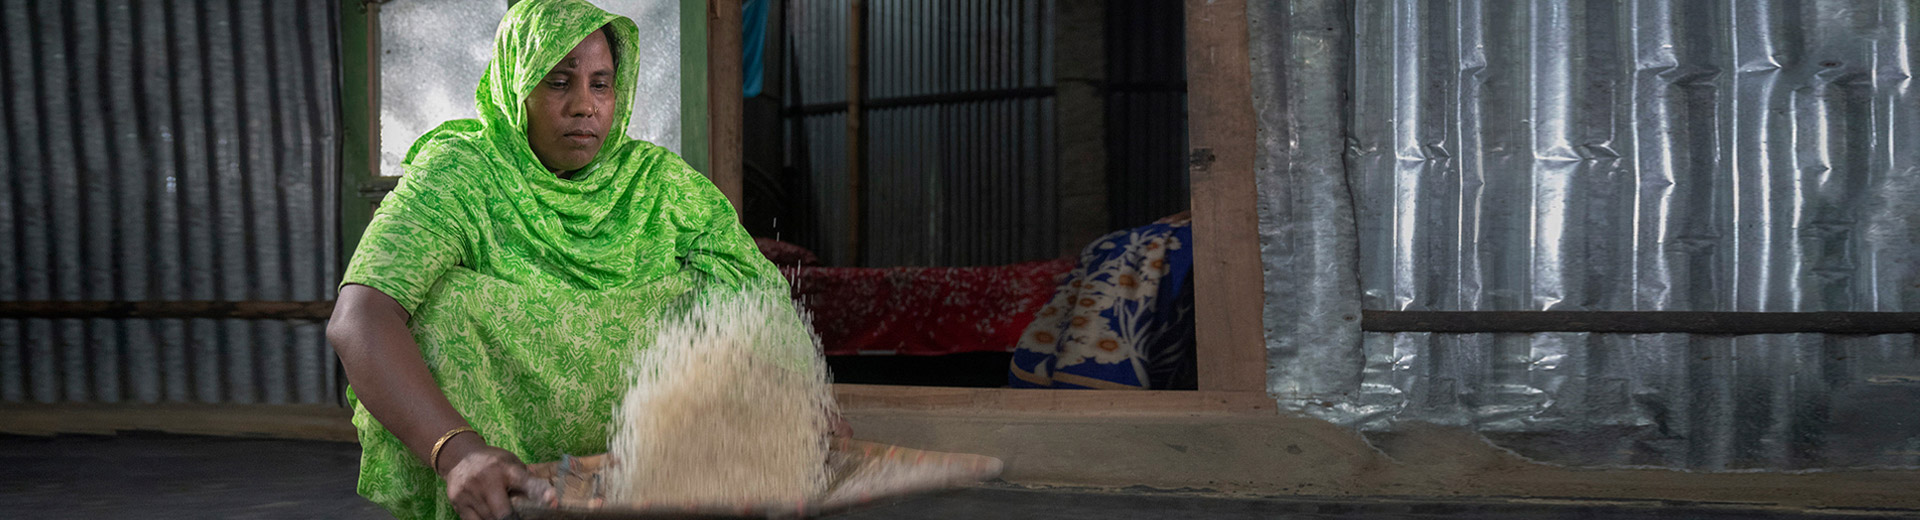
It is our role to step up our efforts to provide countercyclical lending to keep our members fiscally on track during times of uncertainty. Once the COVID-19 crisis is over, AIIB will need to quickly refocus on its mainstream operations in assisting developing members to invest in high-quality infrastructure for development. The crisis has also alerted us to the necessity of improving public health systems to prevent and mitigate the impact of future epidemics. We must leverage the achievements of the past four years to help our borrowing members recover from the economic shock of the pandemic by enhancing their capacity to generate revenue, strengthen their debt sustainability and support the private sector as it rebuilds.

MDBs, in particular, can be facilitators for deeper collaboration and cooperation among governments, regulators, public institutions, the private sector and other funding sources on issues of global importance. Beyond the immediate COVID-19 crisis, climate change remains the greatest long-term challenge facing our members, and we will continue to work to help all of our members achieve their targets under the Paris Agreement. We have joined eight other MDBs in a pledge to increase global climate action investments. This is an area where innovation is sorely needed, and we intend to do our part to identify new approaches to spur investment in climate-aligned projects and investments.

Looking back at what we did in 2019 gives us a better perspective on what has been achieved and what remains to be done. Beyond the immediate consequences of the COVID-19 crisis, there are other changes taking place within the infrastructure financing landscape, influenced by rapid shifts in how markets function and how people live, move and work. Once the world emerges from the pandemic, the needs of people and the economy—along with the development of infrastructure techniques—will dictate what we build and how we build it. One thing we can be sure of amid the current uncertainty is that tomorrow’s infrastructure landscape will look and function very differently from how it does today.

But as long as we keep our mandate in mind and continue to serve our members under the guidance of our Board of Governors and Board of Directors, I have full confidence that AIIB will live up to the expectations of our shareholders and clients.

From Our Board of Directors

MDBs are agents of change. They are well-positioned to fulfill common global needs financially and through the impact these financings lend to the global community. Yet MDBs are merely part of the ecosystem for global change. We need to work with our members and national governments, other international institutions, local and regional organizations and authorities, the private sector and civil society. Collectively, we are all agents of change.

As a collective, MDBs have the capability to respond to three pressing global needs: (1) addressing issues surrounding all three dimensions of sustainable development (economic, social and environmental), (2) bridging borders and economies and (3) closing the infrastructure financing gap. The world stands to gain from addressing all three. AIIB has chosen these as our thematic priorities to respond and contribute to these main obstacles the world is facing.

AIIB is not the only actor in these priorities. In one form or another, our fellow MDBs are also contributing to all three. The global economy and nations worldwide would benefit from MDBs’ assistance in these areas.

From Our Board of Directors
ENLARGE
This is when collective development governance becomes relevant. In terms of environmental policies, global political ecology and economic policies, development governance involves the diplomacy and measures needed to guide social systems toward global needs such as mitigating the effects of climate change, connecting economies or mobilizing private capital to fill the infrastructure funding gap.

Aside from development governance, development diplomacy is also key. This involves deep understanding of how to shape the development discourse among governments, financial institutions, analysts, policy makers and other stakeholders to manage development issues more effectively, collaboratively and efficiently.

Development governance and diplomacy supplement the technical, scientific or economic information we get from field experts. Coupled together, more effective solutions may materialize since governance and diplomacy include the entire set of interactions between public and private agents of change as they attempt to solve societal problems together. MDBs are thus important agents due to the enormity and impact of their organizational capabilities and activities and their role in development governance and diplomacy.

First, in terms of financing sustainable infrastructure, the most obvious contribution of MDBs is their capability to increase climate financing. In 2018, MDB climate finance in developing countries and emerging economies reached record annual levels, resulting in USD111 billion of combined MDB climate finance and cofinancing. Through their projects, MDBs are uniquely positioned to support the implementation of Nationally Determined Contributions outlined in their members’ commitments to the Paris Agreement.

For our part, AIIB is developing debt capital markets for infrastructure and building a sustainable environmental, social and governance ecosystem in emerging markets. MDBs can also manage their own environmental footprint as their activities and investments impact the environment. AIIB is developing a broader Institutional Carbon Management System aimed at reducing carbon emissions related to our facilities, procurement, business travel and waste management. This allows us to not only invest in but also live our Green core value.

Second, development governance and diplomacy can accelerate cross-border connectivity. Cross-border infrastructure is one of the most underserved areas in Asia as evidenced by large connectivity gaps between neighboring and other Asian economies. Infrastructure can connect vital commercial hubs and economies. Yet infrastructures that connect borders are not limited to roads and other physical structures in which we invest. Infrastructure could connect information and data digitally. It could connect energy. It could connect finance. Infrastructure can connect people, services, markets and economies.

When we helped develop a project to improve the highway from Sylhet to Tamabil, our aim was not only to ease the flow of traffic. We wanted to ease the flow of people, goods and services between Bangladesh and India. In one of our earlier investments, we did not intend to merely lay down and connect pipes for a gas pipeline. We knew that energy from gas fields in Azerbaijan can be transmitted through Georgia, Türkiye, Greece and Albania to Italy, thus connecting not just energy but commerce as well by integrating Azerbaijan with new markets in Southern Europe.

Third, MDBs can help mobilize private capital. The challenge in narrowing the infrastructure investment gap is how to transform infrastructure needs into bankable projects while creating financing platforms that allow institutional capital to enter at scale. Doing so will require many actors—from governments to regulators to investors—to collaborate, take action on different issues then bridge the demand and supply of infrastructure.

However, MDBs form but a small portion of the overall infrastructure financing ecosystem. Private capital has the potential to play a much larger role in infrastructure finance. One of our efforts to mobilize such financing in 2019 was an investment in a business platform that would build infrastructure as an asset class and mobilize a new pool of institutional capital for Asian infrastructure. We established a private equity fund to mobilize private capital for infrastructure and other productive sectors by investing in noncontrolling equity stakes in companies in AIIB members. This private equity fund will help our members undergo the energy transition shift by mobilizing private capital investments for renewable energy.

Development can no longer be treated separately from mainstream economic, operational and financial policies by governments, the private sector and multilateral institutions. MDBs in particular need to think and operate differently in the course of their operations. Development governance and diplomacy are key to managing the efforts of various agents of change.

2019 Timeline

Jan. 29

We launched the inaugural Asian Infrastructure Finance report.

Feb. 15

For the third straight year, S&P Global Ratings gave us an AAA/A-1+ (stable) rating.

Feb. 21

We held our first 2019 AIIB Legal Seminar in Hong Kong, China.

March 28

We held our second 2019 AIIB Legal Seminar in Singapore.

April 4

We approved our first investment in Lao PDR. We approved our first investment in Lao PDR

ENLARGE
April 4
April 7
April 8

We became a member of the Global Delivery Initiative.

April 18

Our membership grew to 97 as we approved Côte d’Ivoire, Guinea, Tunisia and Uruguay as prospective members.

April 22

We jointly organized a workshop with the China International Contractors Association to recommend actions for implementing standards for high-quality and sustainable connectivity infrastructure.

May 21
June 8

We held our first Career Opportunities Seminar of the year in France. We held our first Career Opportunities Seminar of the year in France

ENLARGE
June 15

We held our second Career Opportunities Seminar of the year in the United Kingdom. We held our second Career Opportunities Seminar of the year in the United Kingdom

ENLARGE
June 26

We published the second volume of the AIIB Yearbook of International Law.

July 9

For the third straight year, Fitch Ratings gave us an AAA/F1+ (stable) rating.

July 12
July 12
July 12

We announced an agreement to partner with the European Stability Mechanism for technical cooperation, economic and policy strategy exchange, funding, risk management, corporate governance, legal services and staff secondment.

July 12

We announced an agreement to partner with the International Fund for Agricultural Development for cofinancing, private capital mobilization and research.

Sep. 5

For the third straight year, Moody’s Investors Service gave us an Aaa/Prime-1 (stable) rating.

Sep. 11

We held our annual legal conference on the role of international administrative law and our annual law lecture on the rise of sustainable development in international investment law.

Sep. 24

We added Local Currency Financing to our products for clients wishing to mitigate foreign exchange volatilities.

Oct. 15

President Jin discussed water security at the 2019 Budapest Water Summit as AIIB prepared its water sector strategy.

Oct. 24

Construction of our eight-hectare permanent headquarters at the Beijing Olympic Park was completed.

Oct. 31

We held our third 2019 AIIB Legal Seminar in Seoul, Korea.

Nov. 16

We held our third Career Opportunities Seminar in India. We held our third Career Opportunities Seminar in India

ENLARGE
Nov. 18
Nov. 26

The FT-AIIB Summit 2019 was held in Indonesia to drive creativity and innovation in infrastructure finance.

Dec. 9

We held a keynote event and other activities to mark International Anti-corruption Day.

Dec. 10

We launched the Project-affected People’s Mechanism portal, with progressive inclusion of sample submission forms in national/official languages of borrowing members.

Dec. 12
Dec. 12

We approved our first sovereign-backed investment in China in support of its transition to lower-carbon energy.

Dec. 12

A project under our Special Fund was approved, the first project whose preparation we supported from the very early stage. It is also our first sovereign-backed financing investment in Nepal.

Dec. 12

Our total approved project lending reached USD12.04 billion.

Dec. 13

We added Partial Credit Guarantees to our list of products, providing payment security to commercial lenders of infrastructure projects.

Dec. 26

Our permanent headquarters received the LEED Platinum rating (the highest honor for green buildings worldwide) and a three-star rating in the National Green Building Evaluation (the highest in China). Our permanent headquarters received the LEED Platinum rating (the highest honor for green buildings worldwide) and a three-star rating in the National Green Building Evaluation (the highest in China)

ENLARGE
Dec. 31

Our total membership reached 102 as we approved Croatia and Senegal as nonregional prospective members. Our total membership reached 102 as we approved Croatia and Senegal as nonregional prospective members

ENLARGE
TOP